블로그 이미지
보미아빠

카테고리

보미아빠, 석이 (528)
밥벌이 (16)
싸이클 (1)
일상 (1)
Total
Today
Yesterday

달력

« » 2025.9
1 2 3 4 5 6
7 8 9 10 11 12 13
14 15 16 17 18 19 20
21 22 23 24 25 26 27
28 29 30

공지사항

최근에 올라온 글

'보미아빠, 석이'에 해당되는 글 528건

  1. 2016.11.17 SQL Server 2016 Service Pack 1 (SP1) released !!!
  2. 2016.09.29 로그 자르기
  3. 2016.09.27 데이터베이스 상태
  4. 2016.09.02 까봐야 겠다....
  5. 2016.09.01 database project
  6. 2016.09.01 귀연것들....
  7. 2016.08.07 worker thread
  8. 2016.08.07 MEMORY
  9. 2016.08.06 workthread
  10. 2016.08.04 ag lazy log truncation - by design

대박이네~


SQL Server 2016 Service Pack 1 (SP1) released !!!


With cloud first strategy, the SQL Product Team has observed great success and adoption of SQL Server 2016 compared to any previous releases. Today, we are even more excited and pleased to announce the availability of SQL Server 2016 Service Pack 1 (SP1). With SQL Server 2016 SP1, we are making key improvements allowing a consistent programmability surface area for developers and organizations across SQL Server editions. This will enable you to build advanced applications that scale across editions and cloud as you grow. Developers and application partners can now build to a single programming surface when creating or upgrading intelligent applications, and use the edition which scales to the application’s needs.

In addition to a consistent programmability experience across all editions, SQL Server 2016 SP1 also introduces all the supportability and diagnostics improvements first introduced in SQL 2014 SP2, as well as new improvements and fixes centered around performance, supportability, programmability and diagnostics based on the learnings and feedback from customers and SQL community.

SQL Server 2016 SP1 also includes all the fixes up to SQL Server 2016 RTM CU3 including Security Update MS16–136.

Following is the detailed list of improvements introduced in SQL Server 2016 SP1

  • The following table compares the list of features which were only available in Enterprise edition which are now enabled in Standard, Web, Express, and LocalDB editions with SQL Server 2016 SP1. This consistent programmatically surface area allows developers and ISVs to develop and build applications leveraging the following features which can be deployed against any edition of SQL Server installed in the customer environment. The scale and high availability limits do not change, and remain as–is for lower editions as documented in this MSDN article.


    * Requires SQL Server agent which is not part of SQL Server Express Editions
    ** Requires creating filestream file groups which is not possible in Local DB due to insufficient permissions.

  • Database Cloning – Clone database is a new DBCC command added that allows DBAs and support teams to troubleshoot existing production databases by cloning the schema and metadata, statistics without the data. Cloned databases is not meant to be used in production environments. To see if a database has been generated from a call to clonedatabase you can use the following command, select DATABASEPROPERTYEX(‘clonedb’, ‘isClone’). The return value of 1 is true, and 0 is false. In SQL Server 2016 SP1, DBCC CLONEDATABASE added supports cloning of CLR, Filestream/Filetable, Hekaton and Query Store objects. DBCC CLONEDATABASE in SQL 2016 SP1 gives you the ability to generate query store only, statistics only, or pure schema only clone without statistics or query store. A CLONED database always contains the schema and the default clone also contains the statistics and query store data. For more information refer KB 3177838.

    DBCC CLONEDATABASE  (source_database_name, target_database_name)                         –– Default CLONE WITH SCHEMA, STATISTICS and QUERYSTORE metadata.
    DBCC CLONEDATABASE  (source_database_name, target_database_name) WITH NO_STATISTICS                                 –– SCHEMA AND QUERY STORE ONLY CLONE
    DBCC CLONEDATABASE  (source_database_name, target_database_name) WITH NO_QUERYSTORE                              –– SCHEMA AND STATISTICS ONLY CLONE
    DBCC CLONEDATABASE  (source_database_name, target_database_name) WITH NO_STATISTICS,NO_QUERYSTORE    –– SCHEMA ONLY CLONE

  • CREATE OR ALTER (Yes, we heard you !!!) – New CREATE OR ALTER support makes it easier to modify and deploy objects like Stored Procedures, Triggers, User–Defined Functions, and Views. This was one of the highly requested features by developers and SQL Community.
  • New USE HINT query option – A new query option, OPTION(USE HINT(‘<option>’)), is added to alter query optimizer behavior using supported query level hints listed below. Nine different hints are supported to enable functionality which was previously only available via trace flags. Unlike QUERYTRACEON, the USE HINT option does not require sysadmin privileges.


  • Programmatically identify LPIM to SQL service account – New sql_memory_model, sql_memory_model_desc columns in DMV sys.dm_os_sys_info to allow DBAs to programmatically identify if Lock Pages in Memory (LPIM) privilege is in effect at the service startup time.
  • Programatically identify IFI privilege to SQL service account – New column instant_file_initialization_enabled in DMV sys.dm_server_services to allow DBAs to programmatically identify if Instant File initialization (IFI) is in effect at the SQL Server service startup.
  • Tempdb supportability – A new Errorlog message indicating the number of tempdb files and notifying different size/autogrowth of tempdb data files at server startup.
  • Extended diagnostics in showplan XML – Showplan XML extended to support Memory grant warning, expose max memory enabled for the query, information about enabled trace flags, memory fractions for optimized nested loop joins, query CPU time, query elapsed time, top waits, and information about parameters data type.
  • Lightweight per–operator query execution profiling – Dramatically reduces performance overhead of collecting per–operator query execution statistics such as actual number of rows. This feature can be enabled either using global startup TF 7412, or is automatically turned on when an XE session containing query_thread_profile is enabled. When the lightweight profiling is on, the information in sys.dm_exec_query_profiles is also available, enabling the Live Query Statistics feature in SSMS and populating a new DMF sys.dm_exec_query_statistics_xml.
  • New DMF sys.dm_exec_query_statistics_xml – Use this DMF to obtain actual query execution showplan XML (with actual number of rows) for a query which is still being executed in a given session (session id as input parameter). The showplan with a snapshot of current execution statistics is returned when profiling infrastructure (legacy or lightweight) is on.
  • New DMF for incremental statistics – New DMF sys.dm_db_incremental_stats_properties to expose information per–partition for incremental stats.
  • Better correlation between diagnostics XE and DMVs – Query_hash and query_plan_hash are used for identifying a query uniquely. DMV defines them as varbinary(8), while XEvent defines them as UINT64. Since SQL server does not have “unsigned bigint”, casting does not always work. This improvement introduces new XEvent action/filter columns equivalent to query_hash and query_plan_hash except they are defined as INT64 which can help correlating queries between XE and DMVs.
  • Better troubleshooting for query plans with push–down predicate – New EstimatedlRowsRead attribute added in showplan XML for better troubleshooting and diagnostics for query plans with push down predicates.
  • Removing noisy Hekaton logging messages from Errorlog – With SQL 2016, Hekaton engine started logging additional messages in SQL Errorlog for supportability and troubleshooting which was overwhelming and flooded the Errorlog with hekaton messages. Based on feedback from DBAs and SQL community, starting SQL 2016 SP1, the Hekaton logging messages are reduced to minimal in Error log as shown below.
     

  • Improved AlwaysOn Latency Diagnostics – New XEvents and Perfmon diagnostics capability added to troubleshoot latency more efficiently.
  • Manual Change Tracking Cleanup – New cleanup stored procedure sp_flush_CT_internal_table_on_demand introduced to clean the change tracking internal table on demand. For more information, refer KB 3173157.
  • DROP TABLE support for replicationDROP TABLE DDL support for replication to allow replication articles to be dropped. For more information, refer KB 3170123.
  • Signed Filestream RsFx Driver on Windows Server 2016/Windows 10– The Filestream RsFx driver introduced with SQL Server 2016 SP1 is signed and certified using Windows Hardware Developer Center Dashboard portal (Dev Portal) allowing SQL Server 2016 SP1 Filestream RsFx driver to be installed on Windows Server 2016/Windows 10 without any issue. For more information on this issue, refer to the SQL Tiger team blog post here.
  • Bulk insert into heaps with auto TABLOCK under TF 715 – Trace Flag 715 enables table lock for bulk load operations into heap with no non–clustered indexes. When this trace flag is enabled, bulk load operations acquires bulk update (BU) locks when bulk copying data into a table. Bulk update (BU) locks allow multiple threads to bulk load data concurrently into the same table while preventing other processes that are not bulk loading data from accessing the table. The behavior is similar to when the user explicitly specifies TABLOCK hint while performing bulk load or when the sp_tableoption table lock on bulk load is on for a given table however enabling this TF makes this behavior by default without making any query changes or database changes. For more information, refer to the SQL Tiger team blog post here.
  • Parallel INSERT..SELECT Changes for Local temp tables – With SQL Server 2016, Parallel INSERT in INSERT…SELECT operations was introduced. INSERTs into user tables required TABLOCK hint for parallel inserts while INSERTs into local temporary tables were automatically enabled for parallelism without having to designate the TABLOCK hint that user tables require. In a batch workload, INSERT parallelism significantly improves query performance but if there’s a significant concurrent workload trying to run parallel inserts, it causes considerable contention against PFS pages which reduces the overall throughput of the system. This behavior introduced regression in OLTP workload migrating to SQL Server 2016. With SQL Server 2016 SP1, Parallel INSERTs in INSERT..SELECT to local temporary tables is disabled by default and will require TABLOCK hint for parallel insert to be enabled.

All the newly introduced Trace flags with SQL Server 2016 SP1 are documented and can be found at http://aka.ms/traceflags.

The Full versions of the WideWorldImporters sample databases now work with Standard Edition and Express Edition, starting SQL Server 2016 SP1. No changes were needed in the sample. The database backups created at RTM for Enterprise edition simply work with Standard and Express in SP1. Download is here: https://github.com/Microsoft/sql-server-samples/releases/tag/wide-world-importers-v1.0

The SQL Server 2016 SP1 installation may require reboot post installation. As a best practice, we recommend to plan and perform a reboot following the installation of SQL Server 2016 SP1.

We will be updating and adding follow-up posts on the Tiger blog in the coming weeks to describe some of the above improvements in detail.

As noted above, SP1 contains a roll-up of solutions provided in SQL Server 2016 cumulative updates up to and including the latest Cumulative Update – CU3 and Security Update MS16–136 released on November 8th, 2016. Therefore, there is no reason to wait for SP1 CU1 to ‘catch–up‘ with SQL Server 2016 CU3 content.

The Service Pack is available for download on the Microsoft Download Center and ready to use in Azure Images Gallery and will also be made available on the, MSDN, Eval Center, MBS/Partner Source and VLSC in the coming weeks. As part of our continued commitment to software excellence for our customers, this upgrade is available to all customers with existing SQL Server 2016 deployments.

To obtain SQL Server 2016 SP1, please visit the links below:

SQL Server 2016 SP1

SQL Server 2016 SP1 Feature Pack

SQL Server 2016 Service Pack 1 Release Information

Thank you,
Microsoft SQL Server Engineering Team


Posted by 보미아빠
, |

로그 자르기

카테고리 없음 / 2016. 9. 29. 04:47


select @@servername 


-- 반복 시작 (2번이 마지막이면 안짤리니 백업을 해서 넘긴다...뒤로 뒤로..)

backup log userdatabase to 

disk ='NUL'

, disk ='NUL'

, disk ='NUL'

, disk ='NUL'

, disk ='NUL'

, disk ='NUL'

, disk ='NUL'

, disk ='NUL'

go


USE [userdatabase]

GO

DBCC SHRINKFILE (N'userdatabase_Log' , 0, TRUNCATEONLY)

GO


exec sp_helpfile 

--반복 끝


USE [master]

GO

ALTER DATABASE [userdatabase] MODIFY FILE ( NAME = N'userdatabase_Log', SIZE = 30720000KB )

GO


Posted by 보미아빠
, |

https://msdn.microsoft.com/ko-kr/library/ms179900.aspx


select @@servername 


select 

name, case when status & 1 = 1 then 'autoclose' else null end 

,case when status & 4 = 4 then 'select into/bulkcopy' else null end 

,case when status & 8  = 8 then 'trunc. log on chkpt' else null end 

,case when status & 16  = 16 then 'torn page detection' else null end 

,case when status & 32  = 32 then 'loading 복원중' else null end 

,case when status & 64  = 64 then 'pre recovery' else null end 

,case when status & 128  = 128 then 'recovering' else null end 

,case when status & 256  = 256 then 'not recovered' else null end 

,case when status & 512  = 512 then 'offline' else null end 

,case when status & 1024  = 1024 then 'read only' else null end 

,case when status & 2048  = 2048 then 'dbo use only' else null end 

,case when status & 4096  = 4096 then 'single user' else null end 

,case when status & 32768  = 32768 then 'emergency mode' else null end 

,case when status & 65536 = 65536 then 'CHECKSUM' else null end 

,case when status & 4194304 = 4194304 then 'autoshrink' else null end 

,case when status & 1073741824  = 1073741824 then 'cleanly shutdown' else null end 

from master.dbo.sysdatabases 

Posted by 보미아빠
, |

http://www.codeproject.com/Articles/159785/Physical-location-of-a-row-in-SQL-Server


Introduction

First, a warning: These are undocumented and unsupported features in SQL Server so use at your own risk!

In Oracle, there is a pseudo column for each row called ROWID which reveals the physical address of a row in the database file. This column can be used to identify a single row even when a row doesn't have a key. Based on documentation, SQL Server seems to lack this kind of functionality but that's not quite true since SQL Serveralso has a mechanism to identify the physical address of a row. In SQL Server 2008, this is called %%physloc%%, and in SQL Server 2005, %%lockres%%. This article tries to describe the basic usages of this pseudo column inSQL Server 2008.

How is it used

First, let's create a table to test this feature. In order to test different usages, we'll need a table with several rows.

----------------------------------
-- Create test objects
----------------------------------
-- Schema
CREATE SCHEMA PhysLocTest;
GO

-- SeveralRows -table
IF OBJECT_ID ( 'PhysLocTest.SeveralRows', 'U' ) IS NOT NULL 
DROP TABLE PhysLocTest.SeveralRows;
GO

-- Create the table
CREATE TABLE PhysLocTest.SeveralRows (
   Id         int        NOT NULL IDENTITY(1,1)PRIMARY KEY,
   InsertTime date       NOT NULL DEFAULT (GETDATE()),
   Category   varchar(2) NOT NULL
);
GO

-- Fill the table with test data. Contains 100'000 rows in 11 categories
SET NOCOUNT ON
DECLARE @counter int;
BEGIN
   SET @counter = 0;
   WHILE @counter < 100000 BEGIN
      INSERT INTO PhysLocTest.SeveralRows (Category) 
      VALUES (CONVERT(varchar, ROUND( RAND(), 1) * 10 ));

      SET @counter = @counter + 1;
   END;
END;

After the table is created and filled, you can try the %%physloc%% pseudo column:

-----------------------------------------
-- Find physical address of first 5 rows
-----------------------------------------
SELECT TOP(5)
       a.%%physloc%% AS Address,
       a.*
FROM   PhysLocTest.SeveralRows a
ORDER BY a.Id;

-- Results (physical locations, Id's and categories vary):
 
Address             Id  InsertTime  Category
------------------  --  ----------  --------
0xFB0D000001000000  1   2011-02-19  3
0xFB0D000001000100  2   2011-02-19  2
0xFB0D000001000200  3   2011-02-19  4
0xFB0D000001000300  4   2011-02-19  2
0xFB0D000001000400  5   2011-02-19  1

At this point, you'll see that each row has a unique address. The address actually contains information about the file, page, and the slot the row is in. However, the hexadecimal value isn't very easy to interpret, so SQL Serverhas a function called sys.fn_PhysLocFormatter to better visualize the location of the row.

Using sys.fn_PhysLocFormatter

This function takes the physical address as a parameter and formats the address to text to show the location of a row.

-----------------------------------------
-- Find physical address of first 5 rows
-----------------------------------------
SELECT TOP(5)
       a.%%physloc%%                          AS Address,
       sys.fn_PhysLocFormatter(a.%%physloc%%) AS AddressText,
       a.*
FROM   PhysLocTest.SeveralRows a
ORDER BY a.Id;
 

-- Results (physical locations and categories vary):

Address             AddressText  Id  InsertTime  Category
------------------  -----------  --  ----------  --------
0xFB0D000001000000  (1:3579:0)   1   2011-02-19  3
0xFB0D000001000100  (1:3579:1)   2   2011-02-19  2
0xFB0D000001000200  (1:3579:2)   3   2011-02-19  4
0xFB0D000001000300  (1:3579:3)   4   2011-02-19  2
0xFB0D000001000400  (1:3579:4)   5   2011-02-19  1

So now you have the physical address in clear format. Based on the output, row with ID 3 is located in the file 1 on page 3579 and in slot 2. Now you can, for example, identify the actual data file the row is located in using the system view sys.database_files.

-----------------------------------------
-- Find the actual database file
-----------------------------------------
SELECT df.type_desc,
       df.name,
       df.physical_name
FROM   sys.database_files df
WHERE  df.file_id = 1;
 
-- Results:
type_desc  name    physical_name
---------  ------  -------------
ROWS       Test02  C:\Program Files\Microsoft SQL Server\Inst1\MSSQL\DATA\test02.ndf

If you want to go further, you can dump the contents of the block using DBCC PAGE. In order to view information from DBCC PAGE, trace flag 3604 has to be set on. The DBCC PAGE command takes the following parameters:

  • Database name or database ID
  • Number of the file
  • Number of the page
  • Level of detail in the output
    • 0 = header
    • 1 = header and hex dump for rows
    • 2 = header and the page dump
    • 3 = header and detail row information
-----------------------------------------
-- Get the page dump for rows
-----------------------------------------
DBCC TRACEON(3604)
DBCC PAGE (Test, 1, 3579, 1)
DBCC TRACEOFF(3604)
 
-- Results:
PAGE: (1:3579)
 
BUFFER:
BUF @0x0000000084FD4200
bpage = 0x00000000848B0000 bhash = 0x0000000000000000 bpageno = (1:3579)
bdbid = 15 breferences = 0 bcputicks = 0
bsampleCount = 0 bUse1 = 5565 bstat = 0xc0010b
blog = 0xbbbbbbbb bnext = 0x0000000000000000 
 
PAGE HEADER:
Page @0x00000000848B0000
m_pageId = (1:3579) m_headerVersion = 1 m_type = 1
m_typeFlagBits = 0x4 m_level = 0 m_flagBits = 0x0
m_objId (AllocUnitId.idObj) = 365 m_indexId (AllocUnitId.idInd) = 256 
Metadata: AllocUnitId = 72057594061848576 
Metadata: PartitionId = 72057594056081408 Metadata: IndexId = 1
Metadata: ObjectId = 1746821285 m_prevPage = (0:0) m_nextPage = (1:3582)
pminlen = 11 m_slotCnt = 384 m_freeCnt = 10
m_freeData = 7414 m_reservedCnt = 0 m_lsn = (78:1213:16)
m_xactReserved = 0 m_xdesId = (0:0) m_ghostRecCnt = 0
m_tornBits = 0 
 
Allocation Status
GAM (1:2) = ALLOCATED SGAM (1:3) = NOT ALLOCATED 
PFS (1:1) = 0x60 MIXED_EXT ALLOCATED 0_PCT_FULL DIFF (1:6) = CHANGED
ML (1:7) = NOT MIN_LOGGED 
 
DATA:
Slot 0, Offset 0x60, Length 19, DumpStyle BYTE
Record Type = PRIMARY_RECORD Record Attributes = NULL_BITMAP VARIABLE_COLUMNS
Record Size = 19 
Memory Dump @0x000000001613A060
0000000000000000: 30000b00 01000000 ea330b03 000001000.......ê3...... 
0000000000000010: 130033† † † † † † † † † † † † † † † † † † † † † † † † † † † † † † † ..3 
...

Can this be used to speed up fetches

In Oracle, ROWID is sometimes used to speed up fetches (although it's not advisable). Since the ROWID is the physical location of the row, there's no need to locate the row, for example, using an index if the ROWID is already known. Does the same apply to SQL Server? The answer is simply no%%physloc%% acts more like a function so if it is used in the WHERE clause of a SQL statement, SQL Server needs to scan the row locations and then pick up the matching location. To test this, let's try to select a single row from the test table using both ID (primary key) and the location.

-----------------------------------------
-- Fetch the row based on primary key
-----------------------------------------
SELECT a.%%physloc%% AS Address,
       a.*
FROM   PhysLocTest.SeveralRows a
WHERE  a.Id = 4321
 

-- Results:
Address             Id    InsertTime  Category
------------------  ----  ----------  --------
0x641E000001006100  4321  2011-02-19  8
 
-- Statistics:
Table 'SeveralRows'. Scan count 0, logical reads 2, physical reads 0, 
read-ahead reads 0, lob logical reads 0, lob physical reads 0, lob read-ahead reads 0.

And the visual execution plan (total cost 0,0032831, estimated number of rows from index seek = 1):

FetchWithPrimaryKey.jpg

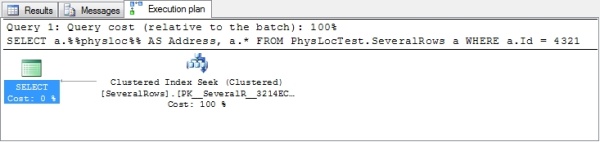
That was quite efficient. When using the ID column in the condition, it's clearly seen in both execution plan and the statistics that SQL Server is using the primary key index to fetch the row. Now what happens if the physical location is used instead?

-------------------------------------------
-- Fetch the row based on physical location
-------------------------------------------
SELECT a.%%physloc%% AS Address,
       a.*
FROM   PhysLocTest.SeveralRows a
WHERE  a.%%physloc%% = 0x641E000001006100
 
-- Results:
Address             Id    InsertTime  Category
------------------  ----  ----------  --------
0x641E000001006100  4321  2011-02-19  8
 
-- Statistics:
Table 'SeveralRows'. Scan count 1, logical reads 29, physical reads 0, 
read-ahead reads 0, lob logical reads 0, lob physical reads 0, lob read-ahead reads 0.

And the visual execution plan (total cost 0,323875, estimated number of rows from index scan = 100'000):

FetchWithPhysicalLocation.jpg

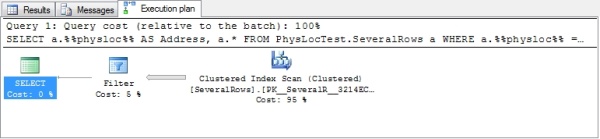
Now SQL Server has to scan the clustered primary key index in order to find the correct physical address. Scan count is 1 and 29 pages are read. Not very good choice from a performance point of view. So we can safely say that using physical location does not provide any kind of performance improvement if used.

Identifying a row without a key

One use-case for physical location is to identify a single row in a table even when the table does not have a key defined on it. A quite common issue is: How can I delete duplicate rows when I don't have a key to use? There are several possibilities to do that. One is to add a key to the table and use it for deletion or perhaps to create a temporary table, load unique rows with the DISTINCT keyword into the temp table, truncate the original table, and reload the distinct data back. Both of these approaches work, but they have a few issues one should think of.

In the first solution (add a key), the table structure is changed, actually the row is widened. Changing the structure is something that should naturally be avoided when simple DML operations (SELECTINSERTUPDATE) are used. In the second solution (reload using a temp table), all the data is deleted and then added back to the original table. This may cause problems and inconsistent data if there are, for example, triggers on the original table.

In our test table, there was a primary key, but let's forget that for a moment. What if I want to delete all duplicate rows so that only one row is left for each category? If the random number generator worked well, there should be 11 categories in the table, values 0-10. So basically, I have to create a delete statement which excludes one row for each category based on the physical location. In the following example, I decided to leave the smallest location for each category and delete the rest. Note: The smallest location isn't necessarily the firstly added row, which could be an easy misunderstanding.

-------------------------------------------
-- Delete duplicates based on Category
-------------------------------------------
DELETE
FROM  PhysLocTest.SeveralRows 
WHERE PhysLocTest.SeveralRows.%%physloc%% 
NOT IN (SELECT MIN(b.%%physloc%%)
        FROM   PhysLocTest.SeveralRows b
        GROUP BY b.Category);
 
-------------------------------------------
-- Check the data
-------------------------------------------
SELECT * 
FROM   PhysLocTest.SeveralRows a
ORDER BY a.Category;
 
-- Results
Id     InsertTime  Category
-----  ----------  --------
9      2011-02-19  0
5      2011-02-19  1
6      2011-02-19  10
2      2011-02-19  2
1      2011-02-19  3
3      2011-02-19  4
21     2011-02-19  5
14     2011-02-19  6
10     2011-02-19  7
17     2011-02-19  8
16     2011-02-19  9
 
(11 row(s) affected)

Task accomplished, duplicates have been removed.

Conclusions

The %%physloc%% pseudo column helps to locate a physical row and dump the contents of the page. This is handy if you want to investigate the structure of the block or you want to find out the actual row where the data is stored. This pseudo column also helps in situations where you have to identify a single row even if you don't have a key defined on the table. In normal SQL Server usage, this column does not provide any improvements that could be used, for example, in programming. So never ever store the value of the physical location in a variable and try to use the value afterwards. No performance is gained, actually vice versa.

When migrating an application from Oracle, %%physloc%% can be used to replace ROWID, but some other approach, most likely a key, should be implemented as soon as possible in order to have decent response times.

Also keep in mind that the physical location of a row can change, for example, when clustered index is rebuilt. And of course, since this is an undocumented and unsupported feature, it may disappear in the next release ofSQL Server.

History

  • February 20, 2011: Created.

License

This article, along with any associated source code and files, is licensed under The Code Project Open License (CPOL)

Share


Posted by 보미아빠
, |

http://www.codeproject.com/Articles/825831/SQL-Server-Database-Development-in-Visual-Studio

Posted by 보미아빠
, |

https://www.youtube.com/watch?v=Se8bbsUFjC8&list=PLqpFVAsustnD0hsoTievuZUD0wlfaa3hh

Posted by 보미아빠
, |

worker thread

카테고리 없음 / 2016. 8. 7. 13:17

declare @session_limit int 

declare @current_worker_cnt int

declare @session_current int 

declare @max_worker_threads int 

select @session_limit = cast(value_in_use as int) from sys.configurations where name = 'user connections'

select @max_worker_threads = cast(value_in_use as int) from sys.configurations where name = 'max worker threads'

select @session_current = count(*) from sys.dm_exec_sessions 

select @current_worker_cnt = count(*) from sys.dm_os_workers 

select 

  @session_limit session_limit

, @session_current current_session_cnt 

, @max_worker_threads max_worker_thread

, @current_worker_cnt current_worker_cnt

, s.scheduler_id

, quantum_used

, is_preemptive

, context_switch_count

, state

, w.last_wait_type

, processor_group

, tasks_processed_count

, w.task_address

, t.session_id 

, se.original_login_name

, se.host_name

, se.program_name 

, r.command 

, r.cpu_time

, r.total_elapsed_time

, r.reads

, r.writes

, r.logical_reads 

, r.sql_handle

, r.query_hash 

, q.dbid

, q.text 

from sys.dm_os_workers w

join sys.dm_os_schedulers s

on w.scheduler_address = s.scheduler_address 

left join sys.dm_os_tasks t

on t.task_address = w.task_address

left join sys.dm_exec_sessions se

on t.session_id = se.session_id

left join sys.dm_exec_requests r 

on se.session_id = r.session_id 

outer apply 

    ( 

    select top 1 * from sys.dm_exec_sql_text (sql_handle) 

    ) q

where r.command is not null

order by quantum_used desc 

Posted by 보미아빠
, |

MEMORY

카테고리 없음 / 2016. 8. 7. 13:06


//SELECT '01' ORDERKEY,'OS_MEMORY_TOTAL' TYPE, PHYSICAL_MEMORY_KB PAGES_KB FROM SYS.DM_OS_SYS_INFO

//UNION ALL 

//SELECT '02' ORDERKEY,'SQL_VISIBLE_TARGET_KB' TYPE, VISIBLE_TARGET_KB PAGES_KB FROM SYS.DM_OS_SYS_INFO

//UNION ALL 

//SELECT '02' ORDERKEY,'SQL_COMMITTED_KB' TYPE, COMMITTED_KB PAGES_KB FROM SYS.DM_OS_SYS_INFO

//UNION ALL 

//SELECT '03' ORDERKEY,'OS_MEMORY_CLERKS_TOTAL' TYPE, SUM(PAGES_KB) PAGES_KB FROM SYS.DM_OS_MEMORY_CLERKS

//UNION ALL 

//SELECT * 

//FROM 

//    ( 

//    SELECT TOP 20 '04' ORDERKEY, TYPE, SUM(PAGES_KB) PAGES_KB  FROM SYS.DM_OS_MEMORY_CLERKS

//    GROUP BY TYPE 

//    ORDER BY 3 DESC 

//    ) A 

//ORDER BY 1,3 DESC 


//-- 데이터베이스별 캐시 사이즈 

//set nocount on

//set transaction isolation level read uncommitted  

//DECLARE @total_buffer INT;


//SELECT @total_buffer = cntr_value

//FROM sys.dm_os_performance_counters 

//WHERE RTRIM([object_name]) LIKE '%Buffer Manager'

//AND counter_name = 'Database Pages';


//;WITH src AS

//(

//SELECT 

//database_id, db_buffer_pages = COUNT_BIG(*)

//FROM sys.dm_os_buffer_descriptors

//--WHERE database_id BETWEEN 5 AND 32766

//GROUP BY database_id

//)

//SELECT

//[db_name] = CASE [database_id] WHEN 32767 

//THEN 'Resource DB' 

//ELSE DB_NAME([database_id]) END,

//db_buffer_pages,

//db_buffer_MB = db_buffer_pages / 128,

//db_buffer_percent = CONVERT(DECIMAL(6,3), 

//db_buffer_pages * 100.0 / @total_buffer)

//FROM src

//ORDER BY db_buffer_MB DESC; 


//-- 인덱스별 사이즈 캐시 사이즈

//set nocount on

//set transaction isolation level read uncommitted  


//;WITH src AS

//(

//SELECT

//[Object] = o.name,

//[Type] = o.type_desc,

//[Index] = COALESCE(i.name, ''),

//[Index_Type] = i.type_desc,

//p.[object_id],

//p.index_id,

//au.allocation_unit_id

//FROM

//sys.partitions AS p

//INNER JOIN

//sys.allocation_units AS au

//ON p.hobt_id = au.container_id

//INNER JOIN

//sys.objects AS o

//ON p.[object_id] = o.[object_id]

//INNER JOIN

//sys.indexes AS i

//ON o.[object_id] = i.[object_id]

//AND p.index_id = i.index_id

//WHERE

//au.[type] IN (1,2,3)

//AND o.is_ms_shipped = 0

//)

//SELECT top 10 

//src.[Object],

//src.[Type],

//src.[Index],

//src.Index_Type,

//buffer_pages = COUNT_BIG(b.page_id),

//buffer_mb = COUNT_BIG(b.page_id) / 128

//FROM

//src

//INNER JOIN

//sys.dm_os_buffer_descriptors AS b

//ON src.allocation_unit_id = b.allocation_unit_id

//WHERE

//b.database_id = DB_ID()

//GROUP BY

//src.[Object],

//src.[Type],

//src.[Index],

//src.Index_Type

//ORDER BY

//buffer_pages DESC;


Posted by 보미아빠
, |

workthread

카테고리 없음 / 2016. 8. 6. 20:38

https://msdn.microsoft.com/ko-kr/library/ms190219.aspx

Posted by 보미아빠
, |

https://blogs.msdn.microsoft.com/sql_pfe_blog/2013/06/27/lazy-log-truncation-clearing-of-sql-transaction-log-vlf-status-deferred/


DBCC LOGINFO 

SELECT * FROM MASTER.SYS.DATABASES 

DBCC SQLPERF(LOGSPACE) 


I came across an oddity in the transaction log when I was testing Availability Group backup scenarios which really had me confused.  It required some help from my colleague Denzil and a few others to figure out what was going on.  This adventure taught us about Lazy Log Truncation.  This is not new to SQL 2012 as it also exists in SQL 2008R2 (and possibly prior), but only when a database is being mirrored or participating in an Availability Group.

For more on VLF’s and transaction log architecture: Transaction Log Physical Architecture

Before getting into the oddity that Lazy Log Truncation brings into play, let’s first look at what you normally see in the transaction log as it is filled and truncated.

I started off creating a database with a fixed log file size of 100MB in full recovery model.  I have this all in the attached script for you to try on your own as well. Once that is set up, take a full database backup to get full recovery model going.  Then run DBCC LOGINFO to show you the current VLFs in the database.


USE [LLTTest]

GO

DBCC LOGINFO –you see here that there are 8 VLFs with 1 that has a status of 2

GO

clip_image002

The status value of 2 means that it is the active portion of the log, meaning that it contains data that needs to be backed up in order for that VLF to be able to be used again.

Next we will do some work in the database that will generate a little log activity.

CREATE TABLE test1 ( myvarchar varchar(5000))

GO

INSERT INTO test1 VALUES( replicate(‘*’,5000))

GO 5000

DELETE FROM test1

Now take a look at DBCC LOFINGO again and you can see that more of the VLFs contain active transaction log data.

clip_image004

Next, we take a backup of the transaction log in order to clear out all the full VLFs and run DBCC LOGINFO again. Note that FSeqNo 35 is still marked as active.  This is because only full VLFs that do not contain log records for active transactions or records needed for replication (mirroring, CDC, replication, etc) are truncated. Also note that there must always be at least 1 active VLF.

BACKUP LOG [LLTTest] TO  DISK = N’C:\Program Files\Microsoft SQL Server\MSSQL11.MSSQLSERVER\MSSQL\Backup\LLTTest.bak’ WITH NOFORMAT, NOINIT, NAME = N’LLTTest-Transaction Log Backup’, SKIP, NOREWIND, NOUNLOAD,  STATS = 10

GO

DBCC LOGINFO –after the tlog backup all but one of the VLFs are inactive (status 0)

GO


clip_image006


This is exactly what you would expect to see, no surprises here.    When it becomes interesting is when you do this same test against a database participating in an Availability Group.  For the sake of keeping this blog entry from being too long, I am not showing you how to add this db to an availability group, but you can do so on your own using the GUI tools.

After adding this database to an availability group, there was no change to the output of DBCC LOGINFO, but one interesting thing to note is that the DBCC LOGINFO output will be identical across all the replicas when everything is synchronized.

Now, we are doing to do the same work we did before to put some activity in the transaction log.

INSERT INTO test1 VALUES( replicate(‘*’,5000))

GO 5000

GO

DELETE FROM test1

GO

DBCC LOGINFO  –Nothing special here, you can see more active VLFs

GO

This looks similar to what we saw before, it is just that different VLFs are being used and the activity rolled over to the beginning of the log file since I have the file set to a fixed size (to make this easier to demo).

clip_image008

Now we will backup the transaction log to truncate the VLFs, right? 

BACKUP LOG [LLTTest] TO  DISK = N’C:\Program Files\Microsoft SQL Server\MSSQL11.MSSQLSERVER\MSSQL\Backup\LLTTest.bak’ WITH NOFORMAT, NOINIT, NAME = N’LLTTest-Transaction Log Backup’, SKIP, NOREWIND, NOUNLOAD,  STATS = 10

GO

DBCC LOGINFO

GO

ACK! The status didn’t clear to 0 on any of the VLFs?! The DBCC LOGINFO output did not change at all. The replica is fully synchronized, so we know it is not due to data not being at all the replicas. The transaction log backup file does contain data, so are those VLFs cleared out or not?

clip_image010


If we do work again, what will happen?  We think the transaction log was just backed up so there should be plenty of free space right? Running DBCC SQLPERF (‘LOGSPACE’) confirms that.  So what will happen?  Will the transaction log fill and return an error? This seems very confusing.  Well let’s give it a shot!

INSERT INTO test1 VALUES( replicate(‘*’,5000))

GO 5000

DELETE FROM test1

–Spoiler Alert:  IT WORKS!!

GO

DBCC LOGINFO 

GO


You can see that FSeqNo 32-35 have been replaced with 40-43.  Even though the VLFs were still considered active, they were able to be reused since they were part of the previous transaction log backup.

clip_image012

We noticed that in a mirroring or Availability Group scenario, Lazy Log Truncation marks the VLFs for truncation, but it does not actually truncate the log unless those VLFs are necessary.  Why is this done?  Well, the primary log truncation has to retain log which may be in use at any of the secondaries. When adding a replica, this aids in minimizing the number of transaction log backups that must be restored in order to get the replica transaction log at the same point as the primary. 

Is this something that you need to be aware of?  Not really, but we thought it was an interesting tidbit about how Availability Groups and mirroring have had so much thought put into them.  We also didn’t want you to be concerned if you happened to notice that a lot of your VLFs are marked as active when you think they have been backed up and should be truncated.

Lisa Gardner – Premier Field Engineer


Comments (7)


  1. Chris Wood

    Lisa,

    We are just starting to use Availablility Groups so should we make our transaction logs bigger than they were on say SQL2005/SQL2008R2? We also have percent log used alerts to fire off log backups. Will these be affected by the lazy log truncation? We have these set at 65%. Should we change this down or up?

    Thanks

    Chris

  2. Even though VLFs are not set as cleared, they are still able to be archived and will be in subsequent tlog backups.  The space will show as empty when you look at % used (via DBCC SQLPERF for example). The point to keep in mind is that any log fragments that have not yet been hardened on replicas cannot be cleared/overwritten.  Therefore, if you have a very long duration of time where a replica is disconnected from the primary, the used tlog space may grow.  So, lazy log truncation does not affect the percent used, but other factors may.  If you are familiar with mirroring, replication, or CDC, the same scenario is in play because there are now multiple points of truncation in the log..

  3. Karthik

    Brilliant blog post and the answer to the question (Question was also well composed, with thoughts in it). Appreciate it.

  4. Michael Docherty

    Great post Lisa, I ran into this scenario this morning when testing some new availability groups and could not figure out why I was still seeing active vlfs using dbcc loginfo, your post has helped me understand.  

  5. peter feakins

    We've run into an issue where we need to shrink a tx log.  We've run a full backup and a transaction log backup.  DBCc SQLPERF now indicates that only 0.16% of the log is used.  Sys.databases log_reuse_wait_desc = nothing.  But all VLFs have a status of 2.   Is Lazy Truncation likely the issue here?  Any ideas how we can shrink the log?

  6. Ron Fisher

    Hello,

    I know this is an old thread but I thought I'd ask similar question about VLF's. I'm a "DBA" not by choice for a medium sized company ~40 SQL instances. We typically run our DB's in Simple recovery if anything for reduced maintenance. Anyway I have a SQL 2012 database that supports a help desk app (Trackit) that is in Simple mode. I typically set log autogrowth from default % to a set Megabyte value (256Meg in this case). After a few months of use the logfile has fragmented into 605 VLF's and counting and 13Gig.

    No big deal right? The weird things is the status on ALL but one of the 605 VLF's is = 2. So this log has one unused VLF and is 99% full. The data file is still at the 256Meg I set it to at the beginning.  I'm guessing all relevant data is stuck in the log file. Any ideas for how to fix this situation if indeed it is a problem.

    Thanks for any insight

    Ron

  7. Fishmannn

    Just realized I hadn't logged on so I wouldn't get any notifications about the post I just placed.. doh!


Posted by 보미아빠
, |

최근에 달린 댓글

최근에 받은 트랙백

글 보관함