

Most common latch classes and what they mean
http://www.sqlskills.com/blogs/paul/most-common-latch-classes-and-what-they-mean/
[Edit 2016: Check out my new resource – a comprehensive library of all wait types and latch classes – see here.]
Back in May I kicked off a survey about prevalent latches on SQL Server instances across the world (see here). It’s taken me quite a while to get around to collating and blogging about the results, but here they are at last!
I got information back for almost 600 servers, and if you remember, I gave you some code to run that would output the top non-page latches that are being waited on during LATCH_XX waits. Non-page latches are those that are neither PAGELATCH_XX (waiting for access to an in-memory copy of a data-file page) nor PAGEIOLATCH_XX(waiting for a data file page to be read into memory from disk).
Every non-page data structure in SQL Server that must be thread-safe (i.e. can be accessed by multiple threads) must have a synchronization mechanism associated with it – either a latch or a spinlock. I blogged about spinlocks last year – see – and they’re used for some data structures that are accessed so frequently, and for such a short time, that even the expense of acquiring a latch is too high. Access to all other data structures is controlled through a latch.
Using wait statistics analysis (see here), if you’re seeing LATCH_EX or LATCH_SH wait types are one of the top 3-4 prevalent wait types, contention for a latch might be contributing to performance issues. If that is the case, you’ll need to use sys.dm_os_latch stats to figure out what the most prevalent latch is – using code similar to that below (with some example output):
|
1
2
3
4
5
6
7
8
9
10
11
12
13
14
15
16
17
18
19
20
21
22
23
24
25
26
27
28
29
30
31
32
33
34
35
36
37
38
39
40
41
42
43
44
45
46
47
48 |
/*============================================================================ File: LatchStats.sql Summary: Snapshot of Latch stats SQL Server Versions: 2005 onwards------------------------------------------------------------------------------ Written by Paul S. Randal, SQLskills.com (c) 2015, SQLskills.com. All rights reserved. For more scripts and sample code, check out You may alter this code for your own *non-commercial* purposes. You may republish altered code as long as you include this copyright and give due credit, but you must obtain prior permission before blogging this code. THIS CODE AND INFORMATION ARE PROVIDED "AS IS" WITHOUT WARRANTY OF ANY KIND, EITHER EXPRESSED OR IMPLIED, INCLUDING BUT NOT LIMITED TO THE IMPLIED WARRANTIES OF MERCHANTABILITY AND/OR FITNESS FOR A PARTICULAR PURPOSE.============================================================================*/WITH [Latches] AS (SELECT [latch_class], [wait_time_ms] / 1000.0 AS [WaitS], [waiting_requests_count] AS [WaitCount], 100.0 * [wait_time_ms] / SUM ([wait_time_ms]) OVER() AS [Percentage], ROW_NUMBER() OVER(ORDER BY [wait_time_ms] DESC) AS [RowNum] FROM sys.dm_os_latch_stats WHERE [latch_class] NOT IN ( N'BUFFER') AND [wait_time_ms] > 0)SELECT MAX ([W1].[latch_class]) AS [LatchClass], CAST (MAX ([W1].[WaitS]) AS DECIMAL(14, 2)) AS [Wait_S], MAX ([W1].[WaitCount]) AS [WaitCount], CAST (MAX ([W1].[Percentage]) AS DECIMAL(14, 2)) AS [Percentage], CAST ((MAX ([W1].[WaitS]) / MAX ([W1].[WaitCount])) AS DECIMAL (14, 4)) AS [AvgWait_S]FROM [Latches] AS [W1]INNER JOIN [Latches] AS [W2] ON [W2].[RowNum] <= [W1].[RowNum]GROUP BY [W1].[RowNum]HAVING SUM ([W2].[Percentage]) - MAX ([W1].[Percentage]) < 95; -- percentage thresholdGO |
LatchClass Wait_S WaitCount Percentage AvgWait_S——————————— ——- ———- ———– ———-LOG_MANAGER 221.43 4659 45.81 0.0475ACCESS_METHODS_HOBT_VIRTUAL_ROOT 199.56 7017 41.28 0.0284FGCB_ADD_REMOVE 35.17 1047 7.27 0.0336DBCC_OBJECT_METADATA 26.85 256490 5.55 0.0001 |
You can also see the latch class of the latches being waited for in the resource_description column of sys.dm_os_waiting_tasks DMV when the wait_type column isLATCH_XX.
The survey results are based on running this code, for latch classes that are the top latch class on 10 or more servers.
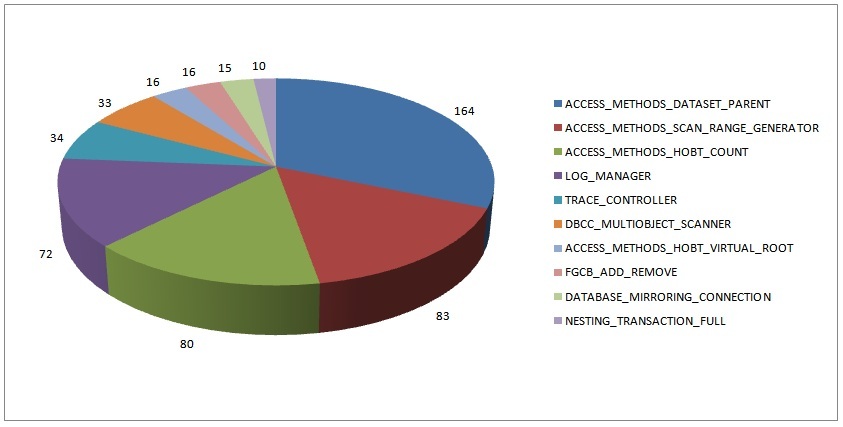
Just like the wait statistics survey results from 2010, I’m not surprised by these results as we see these over and over on client systems.
For the remainder of this post I’m going to list the 10 latch classes represented in the data above in descending order and explain what they mean. Some of this information is from my knowledge of the internals and some of it is from catching the point that latches are acquired using Extended Events and callstack dumping.
Note that when I’m describing a latch class, there may be many instances of that particular latch class. For instance, an FGCB_ADD_REMOVE latch exists for each filegroup in each database attached to the instance.
- 164: ACCESS_METHODS_DATASET_PARENT
- 83: ACCESS_METHODS_SCAN_RANGE_GENERATOR
- These two latches are used during parallel scans to give each thread a range of page IDs to scan. The LATCH_XX waits for these latches will typically appear withCXPACKET waits and PAGEIOLATCH_XX waits (if the data being scanned is not memory-resident). Use normal parallelism troubleshooting methods to investigate further (e.g. is the parallelism warranted? maybe increase ‘cost threshold for parallelism’, lower MAXDOP, use a MAXDOP hint, use Resource Governor to limit DOP using a workload group with a MAX_DOP limit. Did a plan change from index seeks to parallel table scans because a tipping point was reached or a plan recompiled with an atypical SP parameter or poor statistics? Do NOT knee-jerk and set server MAXDOP to 1 – that’s some of the worst advice I see on the Internet.)
- 80: ACCESS_METHODS_HOBT_COUNT
- This latch is used to flush out page and row count deltas for a HoBt (Heap-or-B-tree) to the Storage Engine metadata tables. Contention would indicate *lots* of small, concurrent DML operations on a single table.
- 72: LOG_MANAGER
- If you see this latch it is almost certainly because a transaction log is growing because it could not clear/truncate for some reason. Find the database where the log is growing and then figure out what’s preventing log clearing using: SELECT [log_reuse_wait_desc] FROM sys.databases WHERE [name] = N’youdbname’
- 34: TRACE_CONTROLLER
- This latch is used by SQL Trace for myriad different things, including just generating trace events. Contention on this latch would imply that there are multiple traces on the server tracing lots of stuff – i.e. you’re over-tracing.
- 33: DBCC_MULTIOBJECT_SCANNER
- This latch appears on Enterprise Edition when DBCC CHECK* commands are allowed to run in parallel. It is used by threads to request the next data file page to process. Late last year this was identified as a major contention point inside DBCC CHECK* and there was work done to reduce the contention and make DBCC CHECK* run faster. See KB article 2634571 and Bob Ward’s write-up for more details.
- 16: ACCESS_METHODS_HOBT_VIRTUAL_ROOT
- This latch is used to access the metadata for an index that contains the page ID of the index’s root page. Contention on this latch can occur when a B-tree root page split occurs (requiring the latch in EX mode) and threads wanting to navigate down the B-tree (requiring the latch in SH mode) have to wait. This could be from very fast population of a small index using many concurrent connections, with or without page splits from random key values causing cascading page splits (from leaf to root).
- 16: FGCB_ADD_REMOVE
- FGCB stands for File Group Control Block. This latch is required whenever a file is added or dropped from the filegroup, whenever a file is grown (manually or automatically), when recalculating proportional-fill weightings, and when cycling through the files in the filegroup as part of round-robin allocation. If you’re seeing this, the most common cause is that there’s a lot of file auto-growth happening. It could also be from a filegroup with lots of file (e.g. the primary filegroup in tempdb) where there are thousands of concurrent connections doing allocations. The proportional-fill weightings are recalculated every 8192 allocations, so there’s the possibility of a slowdown with frequent recalculations over many files.
- 15: DATABASE_MIRRORING_CONNECTION
- This latch is involved in controlling the message flow for database mirroring sessions on a server. If this latch is prevalent, I would suspect there are too many busy database mirroring sessions on the server.
- 10: NESTING_TRANSACTION_FULL
- This latch, along with NESTING_TRANSACTION_READONLY, is used to control access to transaction description structures (called an XDES) for parallel nested transactions. The _FULL is for a transaction that’s ‘active’, i.e. it’s changed the database (usually for an index build/rebuild), and that makes the _READONLYdescription obvious. A query that involves a parallel operator must start a sub-transaction for each parallel thread that is used – these transactions are sub-transactions of the parallel nested transaction. For contention on these, I’d investigate unwanted parallelism but I don’t have a definite “it’s usually this problem”. Also check out the comments for some info about these also sometimes being a problem when RCSI is used.
I hope you found this interesting and it helps you out with your performance troubleshooting!